Attribute Mapping: Multivariate Statistical Analysis
Is there too much data for you to find the answers you seek?
When you need a concise understanding of large amounts of data, we can apply multivariate statistics to find the underlying relationships among large numbers of products with many sensory characteristics. Whether it be cluster analysis, factor analysis, principal component analysis or another multivariate technique, we produce simple, easy to understand graphs that illustrate product differences and provide the answers you seek.
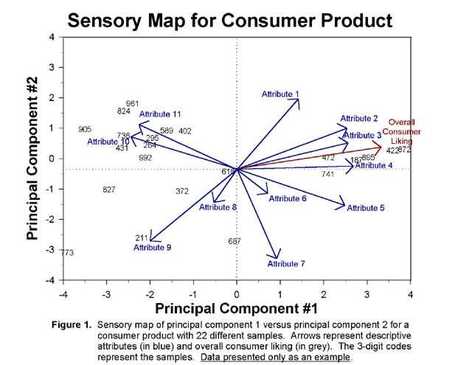
In this example, principal component analysis was applied to further understand the relationship between consumer overall liking scores and the product characteristics as determined by descriptive sensory analysis (10 sensory attributes) for 22 different products.
Quick Summary
Analysis indicates that overall liking by consumers may be related to attributes 2, 3 and 4. This conclusion is supported by the observation that samples 472 and 872 had the highest overall consumer liking (data not shown here) and among the highest intensities of attributes 2, 3 and 4 (data not shown here). Also, the samples in the upper left half of the figure near the border scored at or near the bottom in overall consumer liking (data not shown here) and were low in the levels of attributes 2, 3 and 4.
Therefore, attributes 2, 3 and 4 may be used with other information to estimate overall consumer liking for similar new products.